
Original data · Updated monthly
Asphalt Price Index: 2026 US Prices by State and Region
Current US hot mix asphalt prices, updated monthly. See what asphalt costs per ton in your state, how prices have moved over the past 5 years, and what is driving the numbers in 2026. This page tracks both the finished hot mix price that homeowners and property owners pay, and the liquid asphalt binder index that contractors use for state DOT contracts.
Last updated: July 12, 2026
The headline number
US hot mix asphalt price: 2026 national snapshot
Standard hot mix asphalt costs $100 to $150 per ton for material in 2026, with a national average of approximately $115 to $125 per ton. That is the price for finished HMA at the plant gate, before delivery.
Prices have risen roughly 25% to 40% since 2021, driven by crude oil increases, supply chain disruptions, and strong construction demand. The days of $40 to $80 per ton that older cost guides still quote are over.
The numbers below break this out by state and region so you can see where your area falls.
By region
Hot mix asphalt price per ton by region (2026)
Gulf Coast and Southern states pay the least because they sit closer to petroleum refineries and asphalt plants. Northeast and West Coast states pay the most due to higher labor costs, longer transport distances, and stricter environmental regulations.
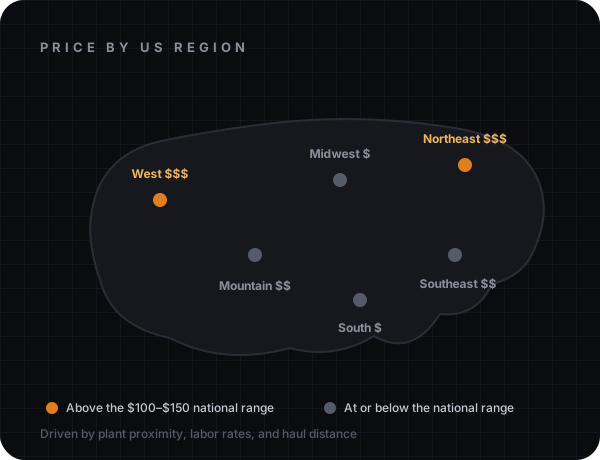
| Region | States | HMA price per ton | Trend vs 2025 |
|---|---|---|---|
| Gulf Coast | TX, LA, MS, AL | $85 to $120 | Stable |
| Southeast | FL, GA, NC, SC, TN | $95 to $135 | Up 3% to 5% |
| South Central | OK, AR | $90 to $125 | Stable |
| Midwest | OH, MI, IL, IN, WI, MN, MO, IA | $100 to $140 | Up 2% to 4% |
| Mountain West | CO, AZ, NV, UT, NM | $100 to $145 | Stable to up 3% |
| Mid-Atlantic | PA, VA, MD, NJ, DE, DC | $115 to $160 | Up 3% to 6% |
| Northeast | NY, MA, CT, RI, VT, NH, ME | $125 to $175 | Up 4% to 7% |
| West Coast | CA, WA, OR | $130 to $180 | Up 5% to 8% |
All 50 states
Hot mix asphalt price by state (2026)
This table shows the estimated range for standard surface-course HMA at the plant gate in each state. Prices vary within each state depending on distance from the nearest plant, order volume, and local market conditions. These are material-only prices. Add $4 to $10 per ton for delivery and $4 to $10 per square foot for installed cost.
| State | HMA price per ton (est.) | State | HMA price per ton (est.) |
|---|---|---|---|
| Alabama | $85 to $120 | Montana | $100 to $140 |
| Alaska | $140 to $200 | Nebraska | $95 to $135 |
| Arizona | $100 to $140 | Nevada | $110 to $150 |
| Arkansas | $90 to $125 | New Hampshire | $125 to $170 |
| California | $130 to $180 | New Jersey | $120 to $165 |
| Colorado | $100 to $145 | New Mexico | $100 to $140 |
| Connecticut | $130 to $175 | New York | $125 to $175 |
| Delaware | $115 to $155 | North Carolina | $95 to $135 |
| Florida | $95 to $130 | North Dakota | $100 to $140 |
| Georgia | $95 to $135 | Ohio | $100 to $140 |
| Hawaii | $160 to $220 | Oklahoma | $90 to $125 |
| Idaho | $105 to $145 | Oregon | $125 to $170 |
| Illinois | $100 to $140 | Pennsylvania | $115 to $160 |
| Indiana | $100 to $135 | Rhode Island | $130 to $175 |
| Iowa | $95 to $135 | South Carolina | $95 to $130 |
| Kansas | $95 to $135 | South Dakota | $100 to $140 |
| Kentucky | $100 to $135 | Tennessee | $95 to $130 |
| Louisiana | $85 to $115 | Texas | $85 to $120 |
| Maine | $130 to $175 | Utah | $100 to $140 |
| Maryland | $115 to $160 | Vermont | $130 to $175 |
| Massachusetts | $130 to $175 | Virginia | $110 to $150 |
| Michigan | $100 to $140 | Washington | $125 to $170 |
| Minnesota | $100 to $140 | West Virginia | $105 to $145 |
| Mississippi | $85 to $115 | Wisconsin | $100 to $140 |
| Missouri | $95 to $135 | Wyoming | $100 to $145 |
Alaska and Hawaii are outliers due to extreme transport costs. In Alaska, asphalt plants are sparse and the paving season is very short. In Hawaii, all petroleum products are shipped by barge.
State-level prices are estimates based on regional averages, DOT binder index data, and published contractor surveys. Cross-check with local supplier quotes before ordering. Reviewed monthly.
The definition
What is the asphalt price index?
The "asphalt price index" most contractors refer to is the liquid asphalt binder price tracked by each state's Department of Transportation. This is not the price of finished hot mix. It is the price of the liquid petroleum-based cement (called AC or asphalt cement) that plants buy in bulk and mix with aggregate to produce HMA.
The binder index matters because state DOT contracts include a price adjustment clause. When the binder price goes up, contractors get a higher payment. When it goes down, payment drops. This protects both sides from large swings in oil prices during a multi-month road project.
For homeowners: you do not need the binder index. The finished HMA price in the tables above is the number that matters when you are buying asphalt for a driveway or parking lot.
For contractors: the binder index tells you whether your material cost is trending up or down month to month, which affects your bids and margins.
Official DOT data
State DOT liquid asphalt binder price index (2026)
This table shows the most recent published binder price from selected state DOTs. These are the official indices used in state contract price adjustments. They track the cost of liquid asphalt cement (PG 64-22 or equivalent), not finished hot mix.
| State DOT | Binder index (per ton, liquid) | Month | Source |
|---|---|---|---|
| Missouri (MoDOT) | $480.00 | January 2026 | modot.org |
| Maryland (MDSHA) | $807.50 | May 2026 | mdasphalt.org |
| Georgia (GDOT) | $653.00 | April 2026 | dot.ga.gov |
| Vermont (VTrans) | $643.00 | January 2026 | vtrans.vermont.gov |
We are adding more state indices as each source is verified. Official index pages for other states: Pennsylvania, New Jersey, North Carolina, Kansas, and California. For the federal producer price index covering asphalt paving mixtures, see FRED.
Why do binder prices vary so much by state? Missouri shows $480/ton while Maryland shows $807.50/ton for the same month because each state's index reflects different things: local refinery output, transport infrastructure, grade specifications (PG 64-22 vs PG 76-22), and the specific averaging formula each DOT uses. They are not directly comparable across states without adjusting for grade and methodology.
The trend
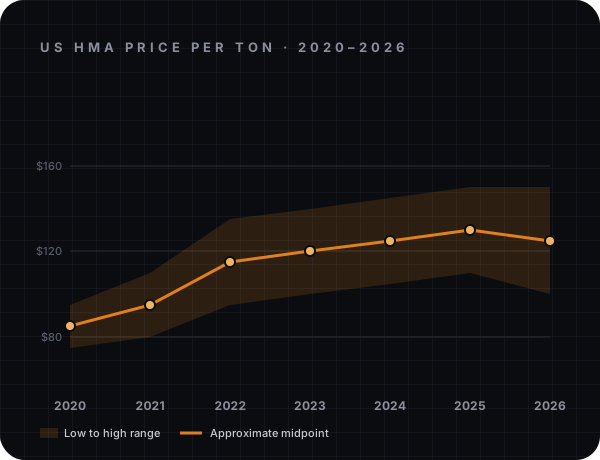
How asphalt prices have changed (2020 to 2026)
Asphalt prices have climbed steadily since 2020, with the sharpest jump in 2022 when crude oil spiked after global supply disruptions. Here is the approximate national average for standard surface-course HMA at the plant gate.
| Year | Approx. HMA price per ton (national avg) | Key driver |
|---|---|---|
| 2020 | $75 to $95 | Low oil prices, reduced demand during pandemic |
| 2021 | $80 to $110 | Demand recovery, supply chain tightening |
| 2022 | $95 to $135 | Crude oil spike, infrastructure bill demand surge |
| 2023 | $100 to $140 | Stabilizing, but elevated oil and labor costs |
| 2024 | $105 to $145 | Continued infrastructure spending, steady demand |
| 2025 | $110 to $150 | Labor costs rising, strong construction season |
| 2026 | $100 to $150 | Slight softening in some regions, oil prices stabilized |
The long-term trend is up. The $40 to $80 per ton figures that many older cost guides still cite reflect 2018 to 2019 pricing and have not been accurate for years. If a contractor or website quotes you $50 per ton for hot mix in 2026, the number is outdated.
Five forces
What drives asphalt prices up and down
Five forces move asphalt pricing at the national level. Understanding them helps you time your project and read your quotes.
1. Crude oil prices
Asphalt is a petroleum byproduct. When crude oil rises, the liquid asphalt binder that holds the mix together costs more, and the per-ton price at the plant follows within 30 to 60 days. This is the single biggest driver of year-over-year price changes.
2. Federal and state infrastructure spending
The 2021 Infrastructure Investment and Jobs Act pumped over $550 billion into roads, bridges, and transit. That surge in demand tightened asphalt supply across the country and pushed prices up, especially in states with large highway programs.
3. Refinery capacity
Asphalt competes with diesel, jet fuel, and petrochemicals for refinery capacity. When refineries prioritize lighter products (which are more profitable), asphalt binder supply shrinks and prices rise, even if crude oil is stable.
4. Seasonal demand
Paving season (May through October) drives prices up 5% to 10% at peak demand in most markets. Plants run at full capacity in summer, and late-season orders sometimes face supply constraints.
5. Regional transport costs
Hot mix has to stay above 275°F during transport. Jobs far from asphalt plants pay more for fuel, insulated trucks, and the risk of material cooling in transit. Rural areas and states with fewer plants (Alaska, Hawaii, parts of the Mountain West) pay a structural premium.
Put it to work
How to use this data
If you are a homeowner pricing a project: use the "Hot mix asphalt price by state" table above to get the material cost per ton in your area. Multiply by the tonnage from our asphalt calculator or driveway cost calculator to estimate your material cost. Then add $4 to $10 per square foot for labor and base to get the installed price.
If you are a contractor tracking margins: bookmark this page and check the state DOT binder index table monthly. When the binder index rises more than 5% in a quarter, adjust your bids accordingly. Use the asphalt cost calculator to price jobs at current rates.
If you are a journalist or researcher: all data on this page is sourced from published state DOT indices, industry reports, and supplier surveys. You are welcome to cite it with a link back to this page. We update the data monthly.
Free calculators
More asphalt tools
Asphalt Calculator
tonnage, cubic yards, and material cost.
Asphalt Driveway Cost Calculator
full installed driveway cost.
Asphalt Cost Per Ton Calculator
material pricing by type and region.
Asphalt Square Yardage Calculator
SY to tons conversion.
Asphalt Parking Lot Calculator
commercial lot by spaces.
Hot Mix Asphalt Calculator
HMA-specific tonnage by mix type.
FAQ
Frequently asked questions
8 questions answered
The asphalt price index is the monthly price of liquid asphalt cement (binder) tracked by each state's Department of Transportation. It is used to adjust payments on state road contracts when material prices change. This is not the price of finished hot mix asphalt. The binder index typically runs $400 to $800+ per ton of liquid, while the finished HMA product that homeowners buy costs $100 to $150 per ton because binder is only about 5% of the total mix by weight.
Standard hot mix asphalt costs $100 to $150 per ton for material at the plant gate in 2026, with a national average of about $115 to $125 per ton. Gulf Coast and Southern states pay the low end ($85 to $120). Northeast and West Coast states pay the high end ($125 to $180). These are material-only prices before delivery.
Yes. Asphalt prices have risen roughly 25% to 40% since 2021, driven by crude oil increases, strong infrastructure spending, and rising labor costs. The national average moved from about $80 to $110 per ton in 2021 to $100 to $150 per ton in 2026. The $40 to $80 per ton figures in older cost guides are no longer accurate.
Asphalt prices vary by state because of proximity to refineries and asphalt plants, local labor costs, transport distances, seasonal demand, and state environmental regulations. Texas and Louisiana sit next to Gulf Coast refineries and pay 30% to 40% less than New York or California, where material has to travel farther and labor costs are higher.
Yes. Asphalt is a byproduct of crude oil refining. When crude oil prices rise, the liquid asphalt binder costs more, and that increase flows into the per-ton price at the plant within 30 to 60 days. Over the past decade, asphalt material prices have moved roughly in step with crude oil, though plant capacity and local demand also play a role.
Asphalt prices adjust monthly at most state DOTs and quarterly at most commercial plants. Large price swings (5%+ in a single month) typically follow sharp moves in crude oil. Seasonal patterns also apply: prices tend to tick up during peak paving season (July and August) and soften slightly in the off-season.
Liquid asphalt binder (also called asphalt cement or AC) is the petroleum-based glue that holds hot mix asphalt together. It is a thick, black, sticky liquid produced at oil refineries and makes up about 5% of the total hot mix by weight. The rest is stone aggregate and sand. The state DOT price index tracks the cost of this binder, not the finished mix product.
A full tandem truckload carries 15 to 20 tons and costs $1,500 to $3,000 for material plus $60 to $200 for delivery depending on distance. At the national average of $115 to $125 per ton, a 20-ton load runs about $2,300 to $2,500 before delivery.
This index is compiled from published state DOT indices, industry reports from the National Asphalt Pavement Association and the Asphalt Institute, and supplier surveys. Methodology is documented on our About page. Found an error? Email hello@getasphaltcalculator.com.
Last updated July 12, 2026. Data is reviewed monthly.